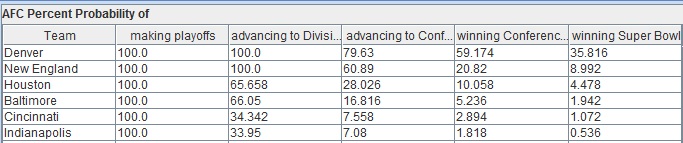
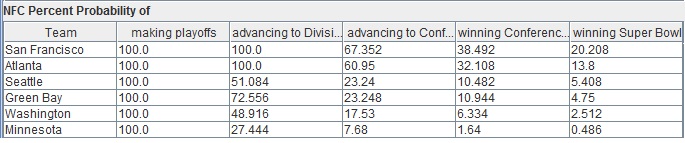
2008 NFL Playoff Predictions after week 13

December 4th, 2008

To run your own scenarios, try using the software at nfl-forecast.com. Single game predictions are based on team efficiency ratings at Advanced NFL Stats

Percent probability of team finishing in each place within the division

AFC EAST

Team 1st 2nd 3rd 4th
NY Jets 54.12 27.38 16.6 1.9
Miami 37.0 32.06 27.9 3.04
New England 8.56 37.52 46.74 7.18
Buffalo 0.32 3.04 8.76 87.88

AFC NORTH

Team 1st 2nd 3rd 4th
Pittsburgh 88.74 11.26 0.0 0.0
Baltimore 11.26 88.74 0.0 0.0
Cleveland 0.0 0.0 97.02 2.98
Cincinnati 0.0 0.0 2.98 97.02

AFC SOUTH

Team 1st 2nd 3rd 4th
Tennessee 99.7 0.3 0.0 0.0
Indianapolis 0.3 99.7 0.0 0.0
Houston 0.0 0.0 78.76 21.24
Jacksonville 0.0 0.0 21.24 78.76

AFC WEST

Team 1st 2nd 3rd 4th
Denver 87.26 12.74 0.0 0.0
San Diego 12.72 86.06 1.06 0.16
Oakland 0.02 0.94 80.34 18.7
Kansas City 0.0 0.26 18.6 81.14

NFC EAST

Team 1st 2nd 3rd 4th
NY Giants 99.92 0.08 0.0 0.0
Washington 0.0 50.1 32.3 17.6
Dallas 0.08 31.62 41.16 27.14
Philadelphia 0.0 18.2 26.54 55.26

NFC NORTH

Team 1st 2nd 3rd 4th
Minnesota 53.92 38.7 7.38 0.0
Chicago 28.46 36.48 35.06 0.0
Green Bay 17.62 24.82 57.56 0.0
Detroit 0.0 0.0 0.0 100.0

NFC SOUTH

Team 1st 2nd 3rd 4th
Tampa Bay 33.9 28.42 37.22 0.46
Carolina 35.2 33.74 28.54 2.52
Atlanta 30.9 36.52 26.38 6.2
New Orleans 0.0 1.32 7.86 90.82

NFC WEST

Team 1st 2nd 3rd 4th
Arizona 100.0 0.0 0.0 0.0
San Francisco 0.0 78.14 20.3 1.56
Seattle 0.0 15.62 64.7 19.68
St Louis 0.0 6.24 15.0 78.76

Generated: Thu Dec 04 14:02:59 EST 2008

AFC Percent Probability Playoff Seeding

Team 1st 2nd 3rd 4th 5th 6th Total
Tennessee 85.08 13.46 1.16 0.0 0.26 0.04 100.0
Pittsburgh 14.6 67.86 6.2 0.08 1.94 8.48 99.16
NY Jets 0.12 7.0 42.56 4.44 1.78 9.52 65.42
Baltimore 0.06 10.08 1.1 0.02 9.9 54.5 75.66
Miami 0.0 1.12 35.54 0.34 0.26 6.88 44.14
Indianapolis 0.14 0.16 0.0 0.0 84.8 11.4 96.5
Denver 0.0 0.1 5.02 82.14 0.0 0.0 87.26
New England 0.0 0.22 8.12 0.22 1.04 8.56 18.16
San Diego 0.0 0.0 0.0 12.72 0.0 0.04 12.76
Buffalo 0.0 0.0 0.3 0.02 0.02 0.56 0.9
Oakland 0.0 0.0 0.0 0.02 0.0 0.0 0.02
Houston 0.0 0.0 0.0 0.0 0.0 0.02 0.02
Cincinnati 0.0 0.0 0.0 0.0 0.0 0.0 0.0
Cleveland 0.0 0.0 0.0 0.0 0.0 0.0 0.0
Jacksonville 0.0 0.0 0.0 0.0 0.0 0.0 0.0
Kansas City 0.0 0.0 0.0 0.0 0.0 0.0 0.0

NFC Percent Probability Playoff Seeding

Team 1st 2nd 3rd 4th 5th 6th Total
NY Giants 84.46 15.4 0.06 0.0 0.02 0.02 99.96
Carolina 11.9 23.1 0.2 0.0 27.04 17.82 80.06
Tampa Bay 2.56 29.84 1.48 0.02 17.78 20.86 72.54
Atlanta 1.04 28.32 1.54 0.0 27.22 16.16 74.28
Arizona 0.0 2.74 76.26 21.0 0.0 0.0 100.0
Minnesota 0.0 0.56 16.82 36.54 0.02 0.02 53.96
Chicago 0.0 0.0 3.4 25.06 0.0 0.18 28.64
Dallas 0.04 0.04 0.0 0.0 11.22 15.26 26.56
Green Bay 0.0 0.0 0.24 17.38 0.0 0.0 17.62
Washington 0.0 0.0 0.0 0.0 15.34 21.4 36.74
Philadelphia 0.0 0.0 0.0 0.0 1.22 7.0 8.22
New Orleans 0.0 0.0 0.0 0.0 0.14 1.28 1.42
Detroit 0.0 0.0 0.0 0.0 0.0 0.0 0.0
St Louis 0.0 0.0 0.0 0.0 0.0 0.0 0.0
San Francisco 0.0 0.0 0.0 0.0 0.0 0.0 0.0
Seattle 0.0 0.0 0.0 0.0 0.0 0.0 0.0

Generated: Thu Dec 04 14:02:59 EST 2008

2008 NFL Playoff predictions after week 12.

November 25th, 2008

 To run your own scenarios, try using the software at nfl-forecast.com. Single game predictions are based on team efficiency ratings at Advanced NFL Stats. Percent probability of team finishing in each place within the divisionAFC EAST

Team 1st 2nd 3rd 4th
NY Jets 64.86 22.26 11.48 1.4
Miami 24.22 37.3 32.04 6.44
New England 9.46 35.64 42.94 11.96
Buffalo 1.46 4.8 13.54 80.2

AFC NORTH

Team 1st 2nd 3rd 4th
Pittsburgh 91.82 8.18 0.0 0.0
Baltimore 8.18 91.78 0.04 0.0
Cleveland 0.0 0.04 93.8 6.16
Cincinnati 0.0 0.0 6.16 93.84

AFC SOUTH

Team 1st 2nd 3rd 4th
Tennessee 99.5 0.5 0.0 0.0
Indianapolis 0.5 99.4 0.1 0.0
Houston 0.0 0.02 58.5 41.48
Jacksonville 0.0 0.08 41.4 58.52

AFC WEST

Team 1st 2nd 3rd 4th
San Diego 56.36 42.18 1.46 0.0
Denver 43.4 55.5 1.1 0.0
Oakland 0.22 2.28 92.7 4.8
Kansas City 0.02 0.04 4.74 95.2

NFC EAST

Team 1st 2nd 3rd 4th
NY Giants 92.62 6.2 1.18 0.0
Washington 6.6 70.68 17.86 4.86
Dallas 0.74 15.68 55.94 27.64
Philadelphia 0.04 7.44 25.02 67.5

NFC NORTH

Team 1st 2nd 3rd 4th
Chicago 66.98 21.2 11.82 0.0
Green Bay 15.6 42.54 41.86 0.0
Minnesota 17.42 36.26 46.32 0.0
Detroit 0.0 0.0 0.0 100.0

NFC SOUTH

Team 1st 2nd 3rd 4th
Carolina 45.38 28.82 19.62 6.18
Atlanta 20.48 33.86 32.48 13.18
Tampa Bay 26.62 25.56 26.68 21.14
New Orleans 7.52 11.76 21.22 59.5

NFC WEST

Team 1st 2nd 3rd 4th
Arizona 100.0 0.0 0.0 0.0
San Francisco 0.0 52.76 41.3 5.94
Seattle 0.0 39.2 47.54 13.26
St Louis 0.0 8.04 11.16 80.8

Generated: Tue Nov 25 18:30:41 EST 2008  AFC Percent Probability Playoff Seeding

Team 1st 2nd 3rd 4th 5th 6th Total
Tennessee 81.32 13.8 4.38 0.0 0.24 0.16 99.9
Pittsburgh 13.58 49.6 28.52 0.12 1.08 3.04 95.94
NY Jets 4.64 25.48 33.9 0.84 4.68 13.34 82.88
New England 0.08 4.6 4.76 0.02 5.34 18.54 33.34
Baltimore 0.08 3.96 4.12 0.02 8.54 31.62 48.34
Miami 0.0 2.24 21.92 0.06 3.0 18.08 45.3
Indianapolis 0.3 0.2 0.0 0.0 76.74 12.66 89.9
San Diego 0.0 0.0 0.02 56.34 0.0 0.06 56.42
Denver 0.0 0.02 1.06 42.32 0.0 0.04 43.44
Buffalo 0.0 0.1 1.32 0.04 0.38 2.44 4.28
Oakland 0.0 0.0 0.0 0.22 0.0 0.0 0.22
Kansas City 0.0 0.0 0.0 0.02 0.0 0.0 0.02
Houston 0.0 0.0 0.0 0.0 0.0 0.02 0.02
Cincinnati 0.0 0.0 0.0 0.0 0.0 0.0 0.0
Cleveland 0.0 0.0 0.0 0.0 0.0 0.0 0.0
Jacksonville 0.0 0.0 0.0 0.0 0.0 0.0 0.0

NFC Percent Probability Playoff Seeding

Team 1st 2nd 3rd 4th 5th 6th Total
NY Giants 72.78 18.46 1.16 0.22 3.78 2.18 98.58
Carolina 17.18 25.66 2.42 0.12 13.24 16.08 74.7
Tampa Bay 3.48 17.74 5.18 0.22 8.2 14.72 49.54
Washington 4.22 2.08 0.28 0.02 48.08 20.36 75.04
Arizona 0.96 16.72 58.9 23.42 0.0 0.0 100.0
Atlanta 0.98 14.02 5.3 0.18 15.36 19.72 55.56
Chicago 0.02 2.06 18.1 46.8 0.02 0.28 67.28
New Orleans 0.04 2.66 3.92 0.9 1.12 7.3 15.94
Dallas 0.28 0.22 0.22 0.02 8.34 15.06 24.14
Minnesota 0.06 0.36 3.46 13.54 0.1 0.44 17.96
Green Bay 0.0 0.0 1.04 14.56 0.0 0.0 15.6
Philadelphia 0.0 0.02 0.02 0.0 1.76 3.86 5.66
Detroit 0.0 0.0 0.0 0.0 0.0 0.0 0.0
St Louis 0.0 0.0 0.0 0.0 0.0 0.0 0.0
San Francisco 0.0 0.0 0.0 0.0 0.0 0.0 0.0
Seattle 0.0 0.0 0.0 0.0 0.0 0.0 0.0

Generated: Tue Nov 25 18:30:41 EST 2008 

2008 Playoff predictions after week 11

November 18th, 2008

To run your own scenarios, try using the software at nfl-forecast.comSingle game predictions are based on team efficiency ratings at Advanced NFL Stats 

Percent probability of team finishing in each place within the division

AFC EAST

Team 1st 2nd 3rd 4th
Miami 60.92 30.42 7.56 1.1
NY Jets 34.18 46.5 16.5 2.82
New England 3.82 15.66 52.0 28.52
Buffalo 1.08 7.42 23.94 67.56

AFC NORTH

Team 1st 2nd 3rd 4th
Pittsburgh 94.02 5.84 0.14 0.0
Baltimore 5.98 92.18 1.84 0.0
Cleveland 0.0 1.96 94.84 3.2
Cincinnati 0.0 0.02 3.18 96.8

AFC SOUTH

Team 1st 2nd 3rd 4th
Tennessee 99.78 0.22 0.0 0.0
Indianapolis 0.22 96.66 3.1 0.02
Jacksonville 0.0 2.94 63.04 34.02
Houston 0.0 0.18 33.86 65.96

AFC WEST

Team 1st 2nd 3rd 4th
Denver 63.36 36.52 0.12 0.0
San Diego 36.56 62.96 0.44 0.04
Oakland 0.06 0.42 72.62 26.9
Kansas City 0.02 0.1 26.82 73.06

NFC EAST

Team 1st 2nd 3rd 4th
NY Giants 80.46 14.36 4.06 1.12
Washington 11.52 48.3 27.1 13.08
Philadelphia 5.54 23.24 33.52 37.7
Dallas 2.48 14.1 35.32 48.1

NFC NORTH

Team 1st 2nd 3rd 4th
Chicago 52.02 28.94 19.04 0.0
Green Bay 33.72 43.7 22.58 0.0
Minnesota 14.26 27.36 58.38 0.0
Detroit 0.0 0.0 0.0 100.0

NFC SOUTH

Team 1st 2nd 3rd 4th
Carolina 51.4 29.44 15.64 3.52
Tampa Bay 32.72 35.9 22.48 8.9
Atlanta 13.14 26.5 41.72 18.64
New Orleans 2.74 8.16 20.16 68.94

NFC WEST

Team 1st 2nd 3rd 4th
Arizona 100.0 0.0 0.0 0.0
San Francisco 0.0 50.52 39.82 9.66
Seattle 0.0 37.7 46.1 16.2
St Louis 0.0 11.78 14.08 74.14

Generated: Tue Nov 18 21:18:05 EST 2008

AFC Percent Probability Playoff Seeding

Team 1st 2nd 3rd 4th 5th 6th Total
Tennessee 93.44 5.22 1.1 0.02 0.2 0.0 99.98
Pittsburgh 5.3 57.32 27.82 3.58 1.22 1.76 97.0
Miami 0.28 21.46 37.24 1.94 12.04 14.72 87.68
NY Jets 0.88 9.92 18.1 5.28 14.0 21.6 69.78
Denver 0.0 1.94 8.46 52.96 0.56 2.48 66.4
Baltimore 0.0 1.98 3.0 1.0 9.36 17.44 32.78
New England 0.02 1.82 1.66 0.32 4.44 10.68 18.94
Indianapolis 0.08 0.12 0.02 0.0 54.76 20.9 75.88
San Diego 0.0 0.08 1.76 34.72 1.38 4.7 42.64
Buffalo 0.0 0.14 0.84 0.1 1.92 5.12 8.12
Oakland 0.0 0.0 0.0 0.06 0.0 0.0 0.06
Kansas City 0.0 0.0 0.0 0.02 0.0 0.0 0.02
Jacksonville 0.0 0.0 0.0 0.0 0.08 0.42 0.5
Cleveland 0.0 0.0 0.0 0.0 0.02 0.12 0.14
Houston 0.0 0.0 0.0 0.0 0.02 0.06 0.08
Cincinnati 0.0 0.0 0.0 0.0 0.0 0.0 0.0

NFC Percent Probability Playoff Seeding

Team 1st 2nd 3rd 4th 5th 6th Total
NY Giants 48.32 21.88 9.12 1.14 9.12 4.78 94.36
Carolina 21.9 20.9 7.94 0.66 12.38 12.38 76.16
Arizona 14.14 22.5 47.0 16.36 0.0 0.0 100.0
Tampa Bay 7.24 17.06 8.1 0.32 12.46 16.0 61.18
Washington 5.18 4.68 1.48 0.18 35.18 18.8 65.5
Philadelphia 1.64 2.74 0.98 0.18 13.72 16.3 35.56
Atlanta 1.02 6.82 5.08 0.22 7.68 12.86 33.68
Dallas 0.5 0.92 1.02 0.04 8.54 14.34 25.36
Chicago 0.02 1.08 11.16 39.76 0.1 0.68 52.8
Green Bay 0.02 0.4 3.52 29.78 0.04 0.38 34.14
Minnesota 0.02 0.4 2.84 11.0 0.1 0.5 14.86
New Orleans 0.0 0.62 1.76 0.36 0.68 2.98 6.4
Detroit 0.0 0.0 0.0 0.0 0.0 0.0 0.0
St Louis 0.0 0.0 0.0 0.0 0.0 0.0 0.0
San Francisco 0.0 0.0 0.0 0.0 0.0 0.0 0.0
Seattle 0.0 0.0 0.0 0.0 0.0 0.0 0.0

Generated: Tue Nov 18 21:18:05 EST 2008

2008 Playoff predictions after week 10

November 12th, 2008

To run your own scenarios, try using the software at nfl-forecast.com

Single game predictions are based on team efficiency ratings at Advanced NFL Stats

Percent probability of team finishing in each place within the division

AFC EAST

Team 1st 2nd 3rd 4th
Miami 53.2 27.82 13.16 5.82
NY Jets 25.6 27.6 26.68 20.12
New England 12.14 24.26 31.76 31.84
Buffalo 9.06 20.32 28.4 42.22

AFC NORTH

Team 1st 2nd 3rd 4th
Pittsburgh 82.36 17.6 0.04 0.0
Baltimore 17.6 81.96 0.44 0.0
Cleveland 0.04 0.42 92.58 6.96
Cincinnati 0.0 0.02 6.94 93.04

AFC SOUTH

Team 1st 2nd 3rd 4th
Tennessee 98.94 1.06 0.0 0.0
Indianapolis 1.04 87.22 10.56 1.18
Jacksonville 0.02 9.64 64.9 25.44
Houston 0.0 2.08 24.54 73.38

AFC WEST

Team 1st 2nd 3rd 4th
San Diego 68.0 31.36 0.62 0.02
Denver 31.9 65.56 2.46 0.08
Oakland 0.1 2.7 74.0 23.2
Kansas City 0.0 0.38 22.92 76.7

NFC EAST

Team 1st 2nd 3rd 4th
NY Giants 58.96 30.12 9.72 1.2
Washington 34.2 44.56 17.94 3.3
Philadelphia 6.46 21.58 54.36 17.6
Dallas 0.38 3.74 17.98 77.9

NFC NORTH

Team 1st 2nd 3rd 4th
Chicago 75.96 16.3 7.74 0.0
Minnesota 14.22 51.88 33.9 0.0
Green Bay 9.82 31.82 58.34 0.02
Detroit 0.0 0.0 0.02 99.98

NFC SOUTH

Team 1st 2nd 3rd 4th
Carolina 51.94 29.02 16.08 2.96
Atlanta 26.24 33.8 30.68 9.28
Tampa Bay 20.14 30.48 35.0 14.38
New Orleans 1.68 6.7 18.24 73.38

NFC WEST

Team 1st 2nd 3rd 4th
Arizona 99.74 0.26 0.0 0.0
Seattle 0.2 40.56 42.9 16.34
San Francisco 0.04 43.58 37.66 18.72
St Louis 0.02 15.6 19.44 64.94

Generated: Tue Nov 11 23:27:04 EST 2008

AFC Percent Probability Playoff Seeding

Team 1st 2nd 3rd 4th 5th 6th Total
Tennessee 90.76 6.16 1.74 0.28 0.84 0.16 99.94
Pittsburgh 5.56 41.34 25.78 9.68 3.08 4.78 90.22
Miami 1.1 21.28 28.68 2.14 9.6 13.58 76.38
NY Jets 1.18 8.82 12.24 3.36 9.26 13.98 48.84
Baltimore 0.18 7.86 6.9 2.66 14.02 18.56 50.18
New England 0.2 5.5 5.3 1.14 7.62 12.5 32.26
San Diego 0.14 4.32 11.9 51.64 1.1 2.02 71.12
Indianapolis 0.7 0.24 0.06 0.04 43.96 18.12 63.12
Buffalo 0.18 3.84 4.6 0.44 9.08 12.14 30.28
Denver 0.0 0.64 2.74 28.52 0.58 2.02 34.5
Cleveland 0.0 0.0 0.04 0.0 0.04 0.08 0.16
Jacksonville 0.0 0.0 0.02 0.0 0.7 1.66 2.38
Oakland 0.0 0.0 0.0 0.1 0.0 0.0 0.1
Houston 0.0 0.0 0.0 0.0 0.12 0.4 0.52
Cincinnati 0.0 0.0 0.0 0.0 0.0 0.0 0.0
Kansas City 0.0 0.0 0.0 0.0 0.0 0.0 0.0

NFC Percent Probability Playoff Seeding

Team 1st 2nd 3rd 4th 5th 6th Total
NY Giants 37.86 14.76 5.16 1.18 20.74 9.94 89.64
Washington 21.98 9.32 2.42 0.48 34.74 13.4 82.34
Carolina 20.2 25.46 5.7 0.58 11.64 12.82 76.4
Arizona 6.46 13.24 37.3 42.74 0.0 0.0 99.74
Atlanta 5.0 13.96 6.02 1.26 7.96 15.58 49.78
Tampa Bay 3.62 11.44 4.2 0.88 7.78 16.58 44.5
Chicago 2.0 6.44 30.64 36.88 0.18 0.7 76.84
Philadelphia 2.28 3.06 0.92 0.2 13.72 20.78 40.96
Minnesota 0.54 1.32 5.04 7.32 0.94 2.82 17.98
Dallas 0.06 0.14 0.14 0.04 2.02 4.4 6.8
New Orleans 0.0 0.6 0.74 0.34 0.28 2.78 4.74
Green Bay 0.0 0.26 1.72 7.84 0.0 0.2 10.02
Seattle 0.0 0.0 0.0 0.2 0.0 0.0 0.2
San Francisco 0.0 0.0 0.0 0.04 0.0 0.0 0.04
St Louis 0.0 0.0 0.0 0.02 0.0 0.0 0.02
Detroit 0.0 0.0 0.0 0.0 0.0 0.0 0.0

Generated: Tue Nov 11 23:27:04 EST 2008

2008 Playoff Predictions after week 9

November 8th, 2008

I’ll be more regular updating the weekly predictions through out the remainder of the season.

To run your own scenarios, try using the software at nfl-forecast.com

Single game predictions are based on team efficiency ratings at Advanced NFL Stats

Percent probability of team finishing in each place within the division

AFC EAST

Team 1st 2nd 3rd 4th
Miami 46.44 32.34 19.0 2.22
Buffalo 30.16 34.1 29.2 6.54
NY Jets 22.32 29.04 37.62 11.02
New England 1.08 4.52 14.18 80.22

AFC NORTH

Team 1st 2nd 3rd 4th
Pittsburgh 93.86 6.12 0.02 0.0
Baltimore 6.14 90.98 2.84 0.04
Cleveland 0.0 2.88 92.02 5.1
Cincinnati 0.0 0.02 5.12 94.86

AFC SOUTH

Team 1st 2nd 3rd 4th
Tennessee 98.32 1.66 0.02 0.0
Indianapolis 1.62 77.56 16.8 4.02
Jacksonville 0.02 11.76 42.08 46.14
Houston 0.04 9.02 41.1 49.84

AFC WEST

Team 1st 2nd 3rd 4th
San Diego 82.94 16.48 0.54 0.04
Denver 16.76 75.7 7.22 0.32
Oakland 0.3 7.18 79.46 13.06
Kansas City 0.0 0.64 12.78 86.58

NFC EAST

Team 1st 2nd 3rd 4th
Washington 41.34 35.32 20.32 3.02
NY Giants 32.26 28.62 31.62 7.5
Philadelphia 25.58 32.78 33.62 8.02
Dallas 0.82 3.28 14.44 81.46

NFC NORTH

Team 1st 2nd 3rd 4th
Chicago 77.96 16.66 5.38 0.0
Green Bay 14.04 44.32 41.62 0.02
Minnesota 8.0 39.02 52.92 0.06
Detroit 0.0 0.0 0.08 99.92

NFC SOUTH

Team 1st 2nd 3rd 4th
Carolina 68.46 21.74 8.08 1.72
Tampa Bay 13.56 31.54 35.4 19.5
Atlanta 13.94 31.44 31.64 22.98
New Orleans 4.04 15.28 24.88 55.8

NFC WEST

Team 1st 2nd 3rd 4th
Arizona 99.06 0.8 0.14 0.0
Seattle 0.48 32.02 38.54 28.96
St Louis 0.24 38.08 27.32 34.36
San Francisco 0.22 29.1 34.0 36.68

Generated: Sat Nov 08 21:54:09 EST 2008

AFC Percent Probability Playoff Seeding

Team 1st 2nd 3rd 4th 5th 6th Total
Tennessee 68.88 21.78 6.66 1.0 1.16 0.3 99.78
Pittsburgh 26.24 42.98 17.18 7.46 2.42 1.66 97.94
Buffalo 2.22 10.58 16.6 0.76 21.96 17.7 69.82
Miami 0.82 12.28 31.2 2.14 16.72 16.14 79.3
NY Jets 0.96 5.32 12.34 3.7 13.56 16.64 52.52
San Diego 0.24 3.9 11.88 66.92 0.58 1.44 84.96
Baltimore 0.22 2.44 2.36 1.12 17.94 17.94 42.02
Indianapolis 0.42 0.5 0.42 0.28 22.12 19.56 43.3
Denver 0.0 0.08 0.78 15.9 0.66 1.96 19.38
New England 0.0 0.12 0.54 0.42 1.26 2.44 4.78
Houston 0.0 0.02 0.02 0.0 1.1 2.32 3.46
Oakland 0.0 0.0 0.0 0.3 0.0 0.0 0.3
Jacksonville 0.0 0.0 0.02 0.0 0.28 1.2 1.5
Cleveland 0.0 0.0 0.0 0.0 0.24 0.7 0.94
Cincinnati 0.0 0.0 0.0 0.0 0.0 0.0 0.0
Kansas City 0.0 0.0 0.0 0.0 0.0 0.0 0.0

NFC Percent Probability Playoff Seeding

Team 1st 2nd 3rd 4th 5th 6th Total
Carolina 31.24 27.58 8.18 1.46 8.2 8.62 85.28
Washington 23.8 12.98 3.98 0.58 28.28 14.3 83.92
NY Giants 17.98 9.3 3.6 1.38 19.58 17.1 68.94
Philadelphia 11.38 9.12 3.96 1.12 23.84 18.5 67.92
Arizona 5.1 12.08 31.84 50.04 0.0 0.0 99.06
Chicago 4.32 11.66 32.7 29.28 0.32 1.02 79.3
Tampa Bay 3.04 6.48 3.12 0.92 7.7 14.36 35.62
Atlanta 2.36 7.46 3.26 0.86 7.2 12.94 34.08
New Orleans 0.26 1.68 1.3 0.8 1.66 5.26 10.96
Minnesota 0.28 0.64 2.8 4.28 1.5 3.04 12.54
Green Bay 0.1 0.7 4.98 8.26 0.14 0.72 14.9
Dallas 0.14 0.32 0.22 0.14 1.58 4.14 6.54
Seattle 0.0 0.0 0.02 0.46 0.0 0.0 0.48
St Louis 0.0 0.0 0.04 0.2 0.0 0.0 0.24
San Francisco 0.0 0.0 0.0 0.22 0.0 0.0 0.22
Detroit 0.0 0.0 0.0 0.0 0.0 0.0 0.0

Generated: Sat Nov 08 21:54:09 EST 2008

2008 Playoff Predictions after Week 5

October 12th, 2008

These are the first predictions for the 2008 season. They were computed before the start of the week 6 games and are posted in order to provide documentation of the prediction accuracy for the 2008 season. I think the predictions are putting a little too much stock in Miami, Tennessee and Arizona so early in the season. We’ll see.

Percent probability of team finishing in each place within the division

AFC EAST

Team 1st 2nd 3rd 4th
Miami 55.32 29.22 13.08 2.38
NY Jets 22.8 32.16 31.18 13.86
Buffalo 20.04 30.88 33.86 15.22
New England 1.84 7.74 21.88 68.54

AFC NORTH

Team 1st 2nd 3rd 4th
Pittsburgh 92.24 7.34 0.4 0.02
Baltimore 7.4 83.06 8.34 1.2
Cincinnati 0.34 6.56 52.1 41.0
Cleveland 0.02 3.04 39.16 57.78

AFC SOUTH

Team 1st 2nd 3rd 4th
Tennessee 83.92 13.74 2.26 0.08
Indianapolis 12.72 53.48 27.86 5.94
Jacksonville 3.28 28.64 51.34 16.74
Houston 0.08 4.14 18.54 77.24

AFC WEST

Team 1st 2nd 3rd 4th
San Diego 66.34 32.08 1.58 0.0
Denver 32.58 60.96 6.42 0.04
Oakland 1.08 6.96 88.62 3.34
Kansas City 0.0 0.0 3.38 96.62

NFC EAST

Team 1st 2nd 3rd 4th
Washington 58.48 36.7 4.3 0.52
NY Giants 38.52 45.24 12.5 3.74
Dallas 2.38 12.24 52.48 32.9
Philadelphia 0.62 5.82 30.72 62.84

NFC NORTH

Team 1st 2nd 3rd 4th
Chicago 83.98 13.74 2.28 0.0
Minnesota 12.92 61.12 25.82 0.14
Green Bay 3.1 25.14 71.46 0.3
Detroit 0.0 0.0 0.44 99.56

NFC SOUTH

Team 1st 2nd 3rd 4th
Carolina 84.7 11.78 2.88 0.64
Tampa Bay 8.1 37.5 34.38 20.02
New Orleans 5.22 32.42 33.44 28.92
Atlanta 1.98 18.3 29.3 50.42

NFC WEST

Team 1st 2nd 3rd 4th
Arizona 97.7 2.16 0.14 0.0
San Francisco 1.56 69.7 22.64 6.1
Seattle 0.66 22.06 54.36 22.92
St Louis 0.08 6.08 22.86 70.98

Generated: Sun Oct 12 11:42:48 EDT 2008

AFC Percent Probability Playoff Seeding

Team 1st 2nd 3rd 4th 5th 6th Total
Tennessee 30.52 22.56 20.08 10.76 3.04 3.9 90.86
Miami 24.08 17.92 10.36 2.96 20.5 11.4 87.22
San Diego 14.04 20.78 22.36 9.16 10.54 9.64 86.52
Pittsburgh 9.16 12.54 17.76 52.78 0.16 0.36 92.76
Buffalo 7.5 6.4 4.62 1.52 19.38 18.46 57.88
Denver 6.38 9.16 10.16 6.88 16.68 15.62 64.88
NY Jets 6.4 6.8 6.86 2.74 18.14 16.98 57.92
Indianapolis 1.38 2.72 4.96 3.66 5.48 9.62 27.82
New England 0.38 0.52 0.7 0.24 3.9 6.26 12.0
Baltimore 0.06 0.12 0.62 6.6 0.44 1.58 9.42
Jacksonville 0.04 0.32 1.08 1.84 0.88 3.42 7.58
Oakland 0.06 0.16 0.42 0.44 0.72 2.38 4.18
Cincinnati 0.0 0.0 0.0 0.34 0.0 0.02 0.36
Houston 0.0 0.0 0.02 0.06 0.14 0.36 0.58
Cleveland 0.0 0.0 0.0 0.02 0.0 0.0 0.02
Kansas City 0.0 0.0 0.0 0.0 0.0 0.0 0.0

NFC Percent Probability Playoff Seeding

Team 1st 2nd 3rd 4th 5th 6th Total
Washington 52.12 5.88 0.42 0.06 36.56 4.16 99.2
NY Giants 33.46 4.42 0.6 0.04 43.6 11.52 93.64
Carolina 9.18 46.18 21.08 8.26 0.56 4.0 89.26
Chicago 2.02 20.54 40.26 21.16 0.08 1.9 85.96
Arizona 1.0 14.02 24.98 57.7 0.0 0.02 97.72
Dallas 1.72 0.56 0.1 0.0 11.66 38.06 52.1
Tampa Bay 0.14 3.36 3.2 1.4 1.04 8.4 17.54
Minnesota 0.04 2.18 5.44 5.26 0.48 5.74 19.14
Philadelphia 0.28 0.16 0.16 0.02 5.32 17.52 23.46
New Orleans 0.04 1.62 1.74 1.82 0.36 5.14 10.72
Atlanta 0.0 0.86 0.76 0.36 0.3 2.96 5.24
Green Bay 0.0 0.2 1.18 1.72 0.02 0.42 3.54
San Francisco 0.0 0.02 0.08 1.46 0.02 0.1 1.68
Seattle 0.0 0.0 0.0 0.66 0.0 0.06 0.72
St Louis 0.0 0.0 0.0 0.08 0.0 0.0 0.08
Detroit 0.0 0.0 0.0 0.0 0.0 0.0 0.0

Generated: Sun Oct 12 11:42:48 EDT 2008

Tooting my own horn

December 31st, 2007

With the conclusion of the NFL season yesterday, it became possible to determine the NFL draft selection order. This year there was a 3-way tie in record and strength of schedule between Atlanta, Kansas City and Oakland for the 4th, 5th and 6th slots. This caused a great deal of confusion with erroneous reports of draft order or procedures coming from numerous outlets including the Atlanta Journal Constitution and several local Kansas City media outlets. The NFL itself took about 18 hours to make sure they were getting it right.

 I’ve been very interested in this question for the last few weeks since I am a Chiefs fan. Using my software I was able to correctly call the draft order and the specific order of the upcoming coinflips the second the Jets winning FG sailed through the uprights. It’s all documented in the link below. I called the draft order before the NFL did. 

http://www.chiefsplanet.com/BB/showthread.php?t=177667

This was a pretty strenuous test of the NFL tiebreaking procedures that I’ve coded into my program, considering that many media outlets trying to sort through the tiebreakers by hand made mistakes.  You can bank on the tiebreakers in my software to give you the right answer.

2007 Playoff Predictions after week 15

December 18th, 2007

I may try to put something up about predicted draft order later in the week since the playoff races are virtually decided, save for one NFC spot.

Percent probability of team finishing in each place within the division

AFC EAST

Team 1st 2nd 3rd 4th
New England 100.0 0.0 0.0 0.0
Buffalo 0.0 100.0 0.0 0.0
NY Jets 0.0 0.0 100.0 0.0
Miami 0.0 0.0 0.0 100.0

AFC NORTH

Team 1st 2nd 3rd 4th
Pittsburgh 74.94 25.06 0.0 0.0
Cleveland 25.06 74.94 0.0 0.0
Cincinnati 0.0 0.0 98.54 1.46
Baltimore 0.0 0.0 1.46 98.54

AFC SOUTH

Team 1st 2nd 3rd 4th
Indianapolis 100.0 0.0 0.0 0.0
Jacksonville 0.0 99.82 0.18 0.0
Tennessee 0.0 0.18 99.0 0.82
Houston 0.0 0.0 0.82 99.18

AFC WEST

Team 1st 2nd 3rd 4th
San Diego 100.0 0.0 0.0 0.0
Denver 0.0 99.88 0.12 0.0
Kansas City 0.0 0.0 77.98 22.02
Oakland 0.0 0.12 21.9 77.98

NFC EAST

Team 1st 2nd 3rd 4th
Dallas 100.0 0.0 0.0 0.0
NY Giants 0.0 93.96 6.04 0.0
Washington 0.0 6.04 57.92 36.04
Philadelphia 0.0 0.0 36.04 63.96

NFC NORTH

Team 1st 2nd 3rd 4th
Green Bay 100.0 0.0 0.0 0.0
Minnesota 0.0 98.1 1.9 0.0
Detroit 0.0 1.9 95.62 2.48
Chicago 0.0 0.0 2.48 97.52

NFC SOUTH

Team 1st 2nd 3rd 4th
Tampa Bay 100.0 0.0 0.0 0.0
New Orleans 0.0 96.34 3.66 0.0
Carolina 0.0 3.66 96.34 0.0
Atlanta 0.0 0.0 0.0 100.0

NFC WEST

Team 1st 2nd 3rd 4th
Seattle 100.0 0.0 0.0 0.0
Arizona 0.0 99.9 0.1 0.0
San Francisco 0.0 0.1 91.58 8.32
St Louis 0.0 0.0 8.32 91.68

Generated: Tue Dec 18 15:54:04 EST 2007

AFC Percent Probability Playoff Seeding

Team 1st 2nd 3rd 4th 5th 6th Total
New England 100.0 0.0 0.0 0.0 0.0 0.0 100.0
Indianapolis 0.0 100.0 0.0 0.0 0.0 0.0 100.0
San Diego 0.0 0.0 66.02 33.98 0.0 0.0 100.0
Pittsburgh 0.0 0.0 24.74 50.2 0.06 23.28 98.28
Cleveland 0.0 0.0 9.24 15.82 0.86 69.96 95.88
Jacksonville 0.0 0.0 0.0 0.0 98.96 0.98 99.94
Tennessee 0.0 0.0 0.0 0.0 0.12 5.78 5.9
Buffalo 0.0 0.0 0.0 0.0 0.0 0.0 0.0
Miami 0.0 0.0 0.0 0.0 0.0 0.0 0.0
NY Jets 0.0 0.0 0.0 0.0 0.0 0.0 0.0
Baltimore 0.0 0.0 0.0 0.0 0.0 0.0 0.0
Cincinnati 0.0 0.0 0.0 0.0 0.0 0.0 0.0
Houston 0.0 0.0 0.0 0.0 0.0 0.0 0.0
Denver 0.0 0.0 0.0 0.0 0.0 0.0 0.0
Kansas City 0.0 0.0 0.0 0.0 0.0 0.0 0.0
Oakland 0.0 0.0 0.0 0.0 0.0 0.0 0.0

NFC Percent Probability Playoff Seeding

Team 1st 2nd 3rd 4th 5th 6th Total
Dallas 68.82 31.18 0.0 0.0 0.0 0.0 100.0
Green Bay 31.18 68.82 0.0 0.0 0.0 0.0 100.0
Seattle 0.0 0.0 61.5 38.5 0.0 0.0 100.0
Tampa Bay 0.0 0.0 38.5 61.5 0.0 0.0 100.0
NY Giants 0.0 0.0 0.0 0.0 48.46 40.66 89.12
Minnesota 0.0 0.0 0.0 0.0 38.86 26.62 65.48
New Orleans 0.0 0.0 0.0 0.0 8.1 21.72 29.82
Washington 0.0 0.0 0.0 0.0 4.58 10.78 15.36
Carolina 0.0 0.0 0.0 0.0 0.0 0.22 0.22
Philadelphia 0.0 0.0 0.0 0.0 0.0 0.0 0.0
Chicago 0.0 0.0 0.0 0.0 0.0 0.0 0.0
Detroit 0.0 0.0 0.0 0.0 0.0 0.0 0.0
Atlanta 0.0 0.0 0.0 0.0 0.0 0.0 0.0
Arizona 0.0 0.0 0.0 0.0 0.0 0.0 0.0
St Louis 0.0 0.0 0.0 0.0 0.0 0.0 0.0
San Francisco 0.0 0.0 0.0 0.0 0.0 0.0 0.0

Generated: Tue Dec 18 15:54:04 EST 2007

2007 Playoff Predictions after week 14

December 11th, 2007

I’ve never seen the races so close to determined this early in the season. The improved bbnflstats.com predictions are partially responsible for the increased certainty, but more than that the way the season has played out there is just really clear stratification of the teams within the conferences.

AFC
NE
IND
PIT — could switch to the 4 seed
SD — could switch to the 3 seed
JAX
CLE — could lose out to Buffalo, Denver or Tennessee

NFC
DAL
GB
SEA
TB
NYG - could drop to 6th
MIN - could rise to 5th or drop their spot to NO, WAS, or ARZ

Percent probability of team finishing in each place within the division

AFC EAST

Team 1st 2nd 3rd 4th
New England 100.0 0.0 0.0 0.0
Buffalo 0.0 100.0 0.0 0.0
NY Jets 0.0 0.0 100.0 0.0
Miami 0.0 0.0 0.0 100.0

AFC NORTH

Team 1st 2nd 3rd 4th
Pittsburgh 93.14 6.86 0.0 0.0
Cleveland 6.86 93.14 0.0 0.0
Cincinnati 0.0 0.0 98.48 1.52
Baltimore 0.0 0.0 1.52 98.48

AFC SOUTH

Team 1st 2nd 3rd 4th
Indianapolis 99.96 0.04 0.0 0.0
Jacksonville 0.04 98.32 1.64 0.0
Tennessee 0.0 1.64 96.26 2.1
Houston 0.0 0.0 2.1 97.9

AFC WEST

Team 1st 2nd 3rd 4th
San Diego 97.3 2.7 0.0 0.0
Denver 2.7 96.52 0.76 0.02
Kansas City 0.0 0.58 78.58 20.84
Oakland 0.0 0.2 20.66 79.14

NFC EAST

Team 1st 2nd 3rd 4th
Dallas 100.0 0.0 0.0 0.0
NY Giants 0.0 98.66 1.34 0.0
Washington 0.0 1.34 67.26 31.4
Philadelphia 0.0 0.0 31.4 68.6

NFC NORTH

Team 1st 2nd 3rd 4th
Green Bay 100.0 0.0 0.0 0.0
Minnesota 0.0 92.72 6.36 0.92
Detroit 0.0 6.06 89.08 4.86
Chicago 0.0 1.22 4.56 94.22

NFC SOUTH

Team 1st 2nd 3rd 4th
Tampa Bay 100.0 0.0 0.0 0.0
New Orleans 0.0 98.1 1.9 0.0
Carolina 0.0 1.9 97.52 0.58
Atlanta 0.0 0.0 0.58 99.42

NFC WEST

Team 1st 2nd 3rd 4th
Seattle 100.0 0.0 0.0 0.0
Arizona 0.0 99.42 0.58 0.0
San Francisco 0.0 0.02 57.7 42.28
St Louis 0.0 0.56 41.72 57.72

Generated: Tue Dec 11 14:44:45 EST 2007

AFC Percent Probability Playoff Seeding

Team 1st 2nd 3rd 4th 5th 6th Total
New England 99.98 0.02 0.0 0.0 0.0 0.0 100.0
Indianapolis 0.02 99.2 0.72 0.02 0.04 0.0 100.0
Pittsburgh 0.0 0.7 61.44 31.0 0.24 6.08 99.46
San Diego 0.0 0.0 34.58 62.72 0.0 0.56 97.86
Cleveland 0.0 0.04 3.22 3.6 6.04 58.26 71.16
Jacksonville 0.0 0.04 0.0 0.0 92.46 6.66 99.16
Denver 0.0 0.0 0.04 2.66 0.02 2.36 5.08
Buffalo 0.0 0.0 0.0 0.0 0.3 19.88 20.18
Tennessee 0.0 0.0 0.0 0.0 0.9 6.2 7.1
Miami 0.0 0.0 0.0 0.0 0.0 0.0 0.0
NY Jets 0.0 0.0 0.0 0.0 0.0 0.0 0.0
Baltimore 0.0 0.0 0.0 0.0 0.0 0.0 0.0
Cincinnati 0.0 0.0 0.0 0.0 0.0 0.0 0.0
Houston 0.0 0.0 0.0 0.0 0.0 0.0 0.0
Kansas City 0.0 0.0 0.0 0.0 0.0 0.0 0.0
Oakland 0.0 0.0 0.0 0.0 0.0 0.0 0.0

NFC Percent Probability Playoff Seeding

Team 1st 2nd 3rd 4th 5th 6th Total
Dallas 95.52 4.26 0.22 0.0 0.0 0.0 100.0
Green Bay 4.44 91.88 3.44 0.24 0.0 0.0 100.0
Seattle 0.04 3.74 86.68 9.54 0.0 0.0 100.0
Tampa Bay 0.0 0.12 9.66 90.22 0.0 0.0 100.0
NY Giants 0.0 0.0 0.0 0.0 75.24 22.08 97.32
Minnesota 0.0 0.0 0.0 0.0 21.02 46.14 67.16
New Orleans 0.0 0.0 0.0 0.0 2.52 20.66 23.18
Washington 0.0 0.0 0.0 0.0 1.22 5.54 6.76
Arizona 0.0 0.0 0.0 0.0 0.0 4.58 4.58
Detroit 0.0 0.0 0.0 0.0 0.0 0.74 0.74
Philadelphia 0.0 0.0 0.0 0.0 0.0 0.16 0.16
Chicago 0.0 0.0 0.0 0.0 0.0 0.08 0.08
Carolina 0.0 0.0 0.0 0.0 0.0 0.02 0.02
Atlanta 0.0 0.0 0.0 0.0 0.0 0.0 0.0
St Louis 0.0 0.0 0.0 0.0 0.0 0.0 0.0
San Francisco 0.0 0.0 0.0 0.0 0.0 0.0 0.0

Generated: Tue Dec 11 14:44:45 EST 2007

2007 Playoff Predictions after week 13

December 4th, 2007

Big winners:
San Diego
Tennessee
Buffalo
Minnesota

Big Losers:
Cleveland
Denver
Washington
Philadelphia

Percent probability of team finishing in each place within the division

AFC EAST

Team 1st 2nd 3rd 4th
New England 100.0 0.0 0.0 0.0
Buffalo 0.0 99.96 0.04 0.0
NY Jets 0.0 0.04 99.92 0.04
Miami 0.0 0.0 0.04 99.96

AFC NORTH

Team 1st 2nd 3rd 4th
Pittsburgh 97.4 2.6 0.0 0.0
Cleveland 2.6 93.04 4.36 0.0
Cincinnati 0.0 4.36 88.26 7.38
Baltimore 0.0 0.0 7.38 92.62

AFC SOUTH

Team 1st 2nd 3rd 4th
Indianapolis 99.84 0.16 0.0 0.0
Jacksonville 0.16 90.34 9.48 0.02
Tennessee 0.0 9.5 89.64 0.86
Houston 0.0 0.0 0.88 99.12

AFC WEST

Team 1st 2nd 3rd 4th
San Diego 98.02 1.98 0.0 0.0
Denver 1.98 73.58 21.74 2.7
Kansas City 0.0 23.52 61.1 15.38
Oakland 0.0 0.92 17.16 81.92

NFC EAST

Team 1st 2nd 3rd 4th
Dallas 100.0 0.0 0.0 0.0
NY Giants 0.0 88.6 8.84 2.56
Philadelphia 0.0 6.22 58.98 34.8
Washington 0.0 5.18 32.18 62.64

NFC NORTH

Team 1st 2nd 3rd 4th
Green Bay 100.0 0.0 0.0 0.0
Minnesota 0.0 90.58 7.32 2.1
Detroit 0.0 6.7 82.34 10.96
Chicago 0.0 2.72 10.34 86.94

NFC SOUTH

Team 1st 2nd 3rd 4th
Tampa Bay 100.0 0.0 0.0 0.0
New Orleans 0.0 77.24 19.56 3.2
Carolina 0.0 19.24 73.8 6.96
Atlanta 0.0 3.52 6.64 89.84

NFC WEST

Team 1st 2nd 3rd 4th
Seattle 96.28 3.72 0.0 0.0
Arizona 3.72 95.62 0.66 0.0
San Francisco 0.0 0.06 54.82 45.12
St Louis 0.0 0.6 44.52 54.88

Generated: Tue Dec 04 21:30:05 EST 2007

AFC Percent Probability Playoff Seeding

Team 1st 2nd 3rd 4th 5th 6th Total
New England 99.7 0.22 0.08 0.0 0.0 0.0 100.0
Indianapolis 0.26 94.64 4.84 0.1 0.14 0.02 100.0
Pittsburgh 0.04 4.98 71.38 21.0 0.34 1.9 99.64
San Diego 0.0 0.0 22.02 76.0 0.0 0.18 98.2
Jacksonville 0.0 0.16 0.0 0.0 86.46 10.38 97.0
Cleveland 0.0 0.0 1.68 0.92 5.18 41.18 48.96
Denver 0.0 0.0 0.0 1.98 0.04 2.04 4.06
Tennessee 0.0 0.0 0.0 0.0 7.0 26.96 33.96
Buffalo 0.0 0.0 0.0 0.0 0.84 17.04 17.88
Cincinnati 0.0 0.0 0.0 0.0 0.0 0.14 0.14
Kansas City 0.0 0.0 0.0 0.0 0.0 0.12 0.12
Houston 0.0 0.0 0.0 0.0 0.0 0.04 0.04
Miami 0.0 0.0 0.0 0.0 0.0 0.0 0.0
NY Jets 0.0 0.0 0.0 0.0 0.0 0.0 0.0
Baltimore 0.0 0.0 0.0 0.0 0.0 0.0 0.0
Oakland 0.0 0.0 0.0 0.0 0.0 0.0 0.0

NFC Percent Probability Playoff Seeding

Team 1st 2nd 3rd 4th 5th 6th Total
Dallas 96.2 3.5 0.24 0.06 0.0 0.0 100.0
Green Bay 3.68 86.52 6.34 3.46 0.0 0.0 100.0
Seattle 0.06 4.9 50.66 40.66 1.84 1.26 99.38
Tampa Bay 0.06 5.08 42.76 52.1 0.0 0.0 100.0
NY Giants 0.0 0.0 0.0 0.0 54.74 30.94 85.68
Arizona 0.0 0.0 0.0 3.72 1.64 11.02 16.38
Minnesota 0.0 0.0 0.0 0.0 35.22 34.76 69.98
New Orleans 0.0 0.0 0.0 0.0 2.1 8.9 11.0
Washington 0.0 0.0 0.0 0.0 2.3 5.42 7.72
Philadelphia 0.0 0.0 0.0 0.0 1.98 5.38 7.36
Detroit 0.0 0.0 0.0 0.0 0.1 1.5 1.6
Chicago 0.0 0.0 0.0 0.0 0.08 0.6 0.68
Carolina 0.0 0.0 0.0 0.0 0.0 0.22 0.22
Atlanta 0.0 0.0 0.0 0.0 0.0 0.0 0.0
St Louis 0.0 0.0 0.0 0.0 0.0 0.0 0.0
San Francisco 0.0 0.0 0.0 0.0 0.0 0.0 0.0

Generated: Tue Dec 04 21:30:05 EST 2007