A couple notes:
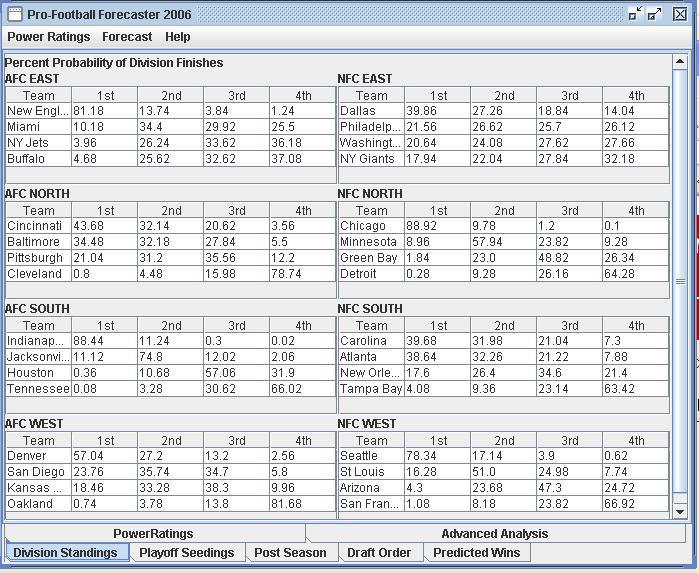
There is a lot of play in the power ratings this week, which means a lot of play in the predictions. I know how to fix this, but probably won’t get to it for a while.
Despite this, I’m confident in saying that at least one of the AFC wild cards will come out of the West. Big losers in the playoff race this week were the Steelers and the Jets. They effectively drop from the race. Not to say they can’t get back in it, but the odds are stacked strongly against them.
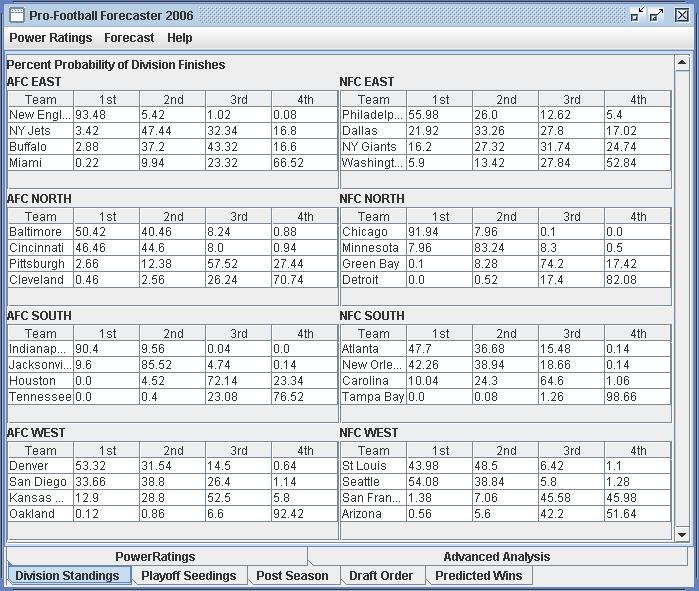
Percent probability of team finishing in each place within the division
AFC EAST
| Team | 1st | 2nd | 3rd | 4th |
| New England | 98.06 | 1.92 | 0.02 | 0.0 |
| NY Jets | 1.92 | 81.32 | 16.4 | 0.36 |
| Buffalo | 0.02 | 16.4 | 77.06 | 6.52 |
| Miami | 0.0 | 0.36 | 6.52 | 93.12 |
AFC NORTH
| Team | 1st | 2nd | 3rd | 4th |
| Baltimore | 83.86 | 15.1 | 1.0 | 0.04 |
| Cincinnati | 15.62 | 74.5 | 9.0 | 0.88 |
| Cleveland | 0.28 | 6.16 | 49.72 | 43.84 |
| Pittsburgh | 0.24 | 4.24 | 40.28 | 55.24 |
AFC SOUTH
| Team | 1st | 2nd | 3rd | 4th |
| Indianapolis | 99.52 | 0.48 | 0.0 | 0.0 |
| Jacksonville | 0.48 | 86.92 | 11.28 | 1.32 |
| Tennessee | 0.0 | 10.68 | 60.36 | 28.96 |
| Houston | 0.0 | 1.92 | 28.36 | 69.72 |
AFC WEST
| Team | 1st | 2nd | 3rd | 4th |
| Denver | 59.22 | 28.24 | 12.5 | 0.04 |
| San Diego | 28.44 | 40.6 | 30.56 | 0.4 |
| Kansas City | 12.34 | 31.04 | 55.04 | 1.58 |
| Oakland | 0.0 | 0.12 | 1.9 | 97.98 |
NFC EAST
| Team | 1st | 2nd | 3rd | 4th |
| NY Giants | 90.24 | 8.4 | 1.26 | 0.1 |
| Dallas | 7.2 | 54.44 | 29.14 | 9.22 |
| Philadelphia | 2.0 | 26.72 | 42.14 | 29.14 |
| Washington | 0.56 | 10.44 | 27.46 | 61.54 |
NFC NORTH
| Team | 1st | 2nd | 3rd | 4th |
| Chicago | 94.46 | 5.46 | 0.08 | 0.0 |
| Minnesota | 5.32 | 81.18 | 12.42 | 1.08 |
| Green Bay | 0.22 | 12.2 | 66.94 | 20.64 |
| Detroit | 0.0 | 1.16 | 20.56 | 78.28 |
NFC SOUTH
| Team | 1st | 2nd | 3rd | 4th |
| Atlanta | 53.34 | 38.6 | 7.24 | 0.82 |
| New Orleans | 43.0 | 44.98 | 11.12 | 0.9 |
| Carolina | 3.48 | 14.56 | 65.02 | 16.94 |
| Tampa Bay | 0.18 | 1.86 | 16.62 | 81.34 |
NFC WEST
| Team | 1st | 2nd | 3rd | 4th |
| Seattle | 71.44 | 27.86 | 0.7 | 0.0 |
| St Louis | 28.4 | 69.36 | 2.08 | 0.16 |
| San Francisco | 0.14 | 2.34 | 63.92 | 33.6 |
| Arizona | 0.02 | 0.44 | 33.3 | 66.24 |
Generated: Tue Oct 31 00:21:13 EST 2006
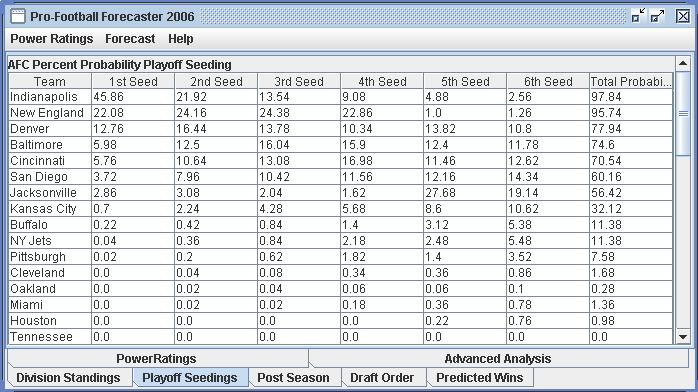
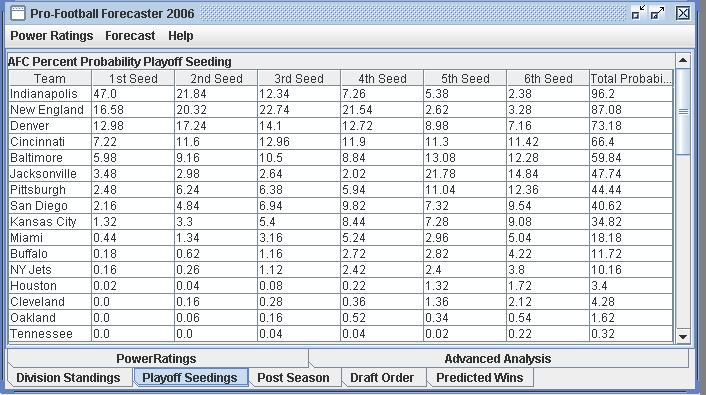
AFC Percent Probability Playoff Seeding
| Team | 1st | 2nd | 3rd | 4th | 5th | 6th | Total |
| Indianapolis | 73.62 | 19.34 | 5.24 | 1.32 | 0.38 | 0.1 | 100.0 |
| New England | 20.1 | 35.9 | 26.9 | 15.16 | 0.4 | 0.58 | 99.04 |
| Baltimore | 3.0 | 14.5 | 24.14 | 42.22 | 3.18 | 4.16 | 91.2 |
| Denver | 2.24 | 21.2 | 23.92 | 11.86 | 20.48 | 11.26 | 90.96 |
| San Diego | 0.84 | 6.16 | 10.34 | 11.1 | 25.84 | 18.02 | 72.3 |
| Kansas City | 0.12 | 1.84 | 5.38 | 5.0 | 18.94 | 19.4 | 50.68 |
| Cincinnati | 0.0 | 0.82 | 3.26 | 11.54 | 8.62 | 14.1 | 38.34 |
| Jacksonville | 0.08 | 0.1 | 0.16 | 0.14 | 15.28 | 17.14 | 32.9 |
| NY Jets | 0.0 | 0.14 | 0.62 | 1.16 | 5.72 | 11.64 | 19.28 |
| Pittsburgh | 0.0 | 0.0 | 0.02 | 0.22 | 0.06 | 0.14 | 0.44 |
| Cleveland | 0.0 | 0.0 | 0.0 | 0.28 | 0.28 | 0.84 | 1.4 |
| Buffalo | 0.0 | 0.0 | 0.02 | 0.0 | 0.76 | 2.06 | 2.84 |
| Tennessee | 0.0 | 0.0 | 0.0 | 0.0 | 0.04 | 0.36 | 0.4 |
| Oakland | 0.0 | 0.0 | 0.0 | 0.0 | 0.02 | 0.06 | 0.08 |
| Houston | 0.0 | 0.0 | 0.0 | 0.0 | 0.0 | 0.14 | 0.14 |
| Miami | 0.0 | 0.0 | 0.0 | 0.0 | 0.0 | 0.0 | 0.0 |
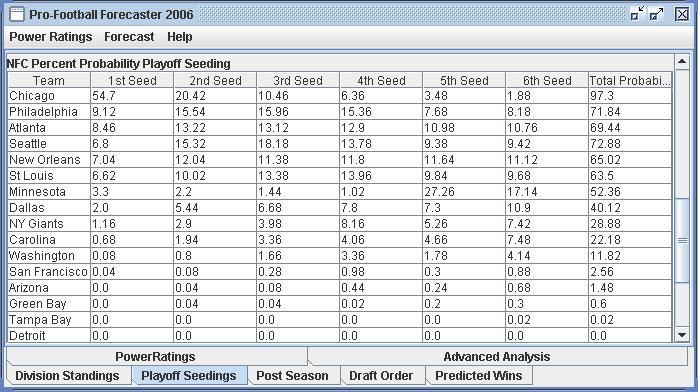
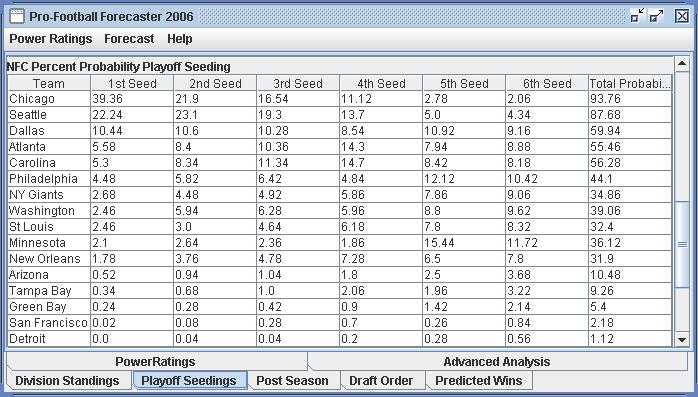
NFC Percent Probability Playoff Seeding
| Team | 1st | 2nd | 3rd | 4th | 5th | 6th | Total |
| Chicago | 61.04 | 21.2 | 8.64 | 3.58 | 3.52 | 1.22 | 99.2 |
| NY Giants | 18.84 | 26.26 | 22.06 | 23.08 | 1.56 | 2.34 | 94.14 |
| New Orleans | 6.68 | 14.26 | 13.18 | 8.88 | 17.3 | 16.54 | 76.84 |
| Atlanta | 5.84 | 16.24 | 16.94 | 14.32 | 13.3 | 13.18 | 79.82 |
| Seattle | 2.82 | 14.16 | 25.04 | 29.42 | 4.06 | 6.78 | 82.28 |
| Minnesota | 2.74 | 1.22 | 1.02 | 0.34 | 39.32 | 20.14 | 64.78 |
| St Louis | 1.48 | 4.12 | 8.92 | 13.88 | 8.6 | 12.82 | 49.82 |
| Dallas | 0.38 | 1.72 | 2.22 | 2.88 | 7.2 | 12.44 | 26.84 |
| Carolina | 0.12 | 0.56 | 1.3 | 1.5 | 2.14 | 5.52 | 11.14 |
| Washington | 0.04 | 0.04 | 0.1 | 0.38 | 0.46 | 1.46 | 2.48 |
| Philadelphia | 0.0 | 0.18 | 0.46 | 1.36 | 1.56 | 4.96 | 8.52 |
| Green Bay | 0.02 | 0.02 | 0.08 | 0.1 | 0.74 | 1.66 | 2.62 |
| Tampa Bay | 0.0 | 0.02 | 0.04 | 0.12 | 0.24 | 0.74 | 1.16 |
| San Francisco | 0.0 | 0.0 | 0.0 | 0.14 | 0.0 | 0.06 | 0.2 |
| Arizona | 0.0 | 0.0 | 0.0 | 0.02 | 0.0 | 0.0 | 0.02 |
| Detroit | 0.0 | 0.0 | 0.0 | 0.0 | 0.0 | 0.14 | 0.14 |
Generated: Tue Oct 31 00:21:13 EST 2006